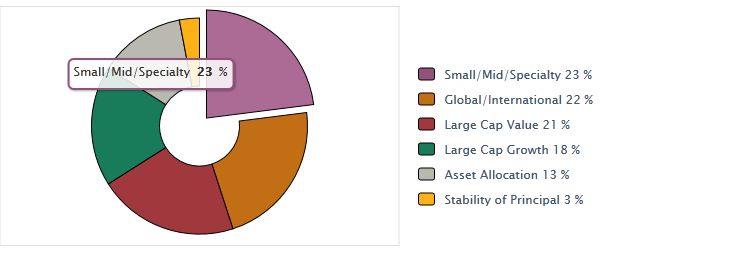
Plan Investment Chart as of January 1, YYYY
Balances as of January 1, YYYY
To better understand the investment option information provided to you, please carefully review this additional information about types of investment risks and glossary of terms and statistics found on the fund fact sheets. Documentation will also provide instructions about how to obtain any underlying fund prospectus.
Do you want to see what your total balance translates into monthly income in retirement? You can review your monthly income estimate and illustrate different scenarios.
| Fund Name | # of Units | Unit Price | Fund Balance | % of Balance |
|---|---|---|---|---|
| ASSET ALLOCATION | ||||
| Target Date 2040 Fund | 426.7650 | 23.4321 | $10,000.00 | 28.57% |
| BONDS | ||||
| Bond Fund | 57.4699 | 87.0021 | $5,000.00 | 14.29% |
| GLOBAL/INTERNATIONAL | ||||
| International Equity Fund | 63.1363 | 55.4356 | 3,500.00 | 10.00% |
| LARGE CAP GROWTH | ||||
| Large Cap Growth Fund | 224.1938 | 33.4532 | 7,500.00 | 21.43% |
| LARGE CAP VALUE/BLEND | ||||
| Large Cap Value Fund | 120.2803 | 29.0987 | $3,500.00 | 10.00% |
| SMALL/MID/SPECIALTY | ||||
| Small Cap Equity Fund | 26.7375 | 67.3211 | $1,800.00 | 5.14% |
| STABILITY OF PRINCIPAL | ||||
| Stable Value Option | 36.5930 | 101.1123 | $3,700.00 | 10.57% |
| Total | $35,000.00 | 100.00% |
Review fund prices.